04Analysis platform
From raw muon events to a cited report.
Our analysis software reads muon data from any detector, reconstructs density in 3D, states the uncertainty and ranks where to verify first against your records.
On this pageEvery figure on this page comes from simulation with known truth, and says so.
01Analysis chain
What happens to your data.
Our surveys and your own detector go through the same four stages. Because we start from raw events, every step can be checked.
Raw events in
Event lists in a documented format, from any detector. CosmicWatch run folders are read straight off the SD card.
Density in 3D
Transmission against an open-sky reference, then a regularised 3D reconstruction. The same code runs in Python and in the browser, checked to agree.
Uncertainty and coverage
Stated with every result, together with what one viewpoint cannot fix: depth.
A cited report
What was measured, what it shows, what it cannot show and what to check first, written for the engineer who acts on it.
02Ranking
Where to drill first, and why.
A density map alone does not say where to dig. Set against your site records, it becomes a ranked list of places to check. Boreholes and GPR stay in your programme; the list says where to use them first.
Your records, weighed in
Boreholes, InSAR, geology and inspection records are combined with the muon result. A record you do not hold counts as unknown, not as clear.
Ranked, with the first check
Locations are ordered by confidence, each with the check to run first: a borehole, a GPR line or a second viewpoint for depth.
Physics scores; the model explains
The score comes from the physics and a Bayesian combination of the evidence. A language model only explains cited evidence, and every statement names its source.
03Validation
How we test the method.
Every test runs against an answer known in advance.
Component
Channels, timing, alignment and stability are checked, and directional acceptance is characterised.
Instrument recordSimulation, truth known
Randomised sites run through the whole chain, and every step is scored against the truth. The run below is one of them.
Scored runsBlind test, truth withheld
The truth is sealed before analysis starts, and opened only after the analysts commit to a result.
Sealed, then scoredField cross-check
On site, the top-ranked locations are checked directly, and each outcome is recorded against its rank.
Confirmed or not, on record04Validation run
A randomised validation run, start to finish.
One randomised site, simulated, then measured, reconstructed and ranked by the same code we run on detector data. Everything it produced is here, including where it went wrong.
Simulation with known ground truth, not a field case study.
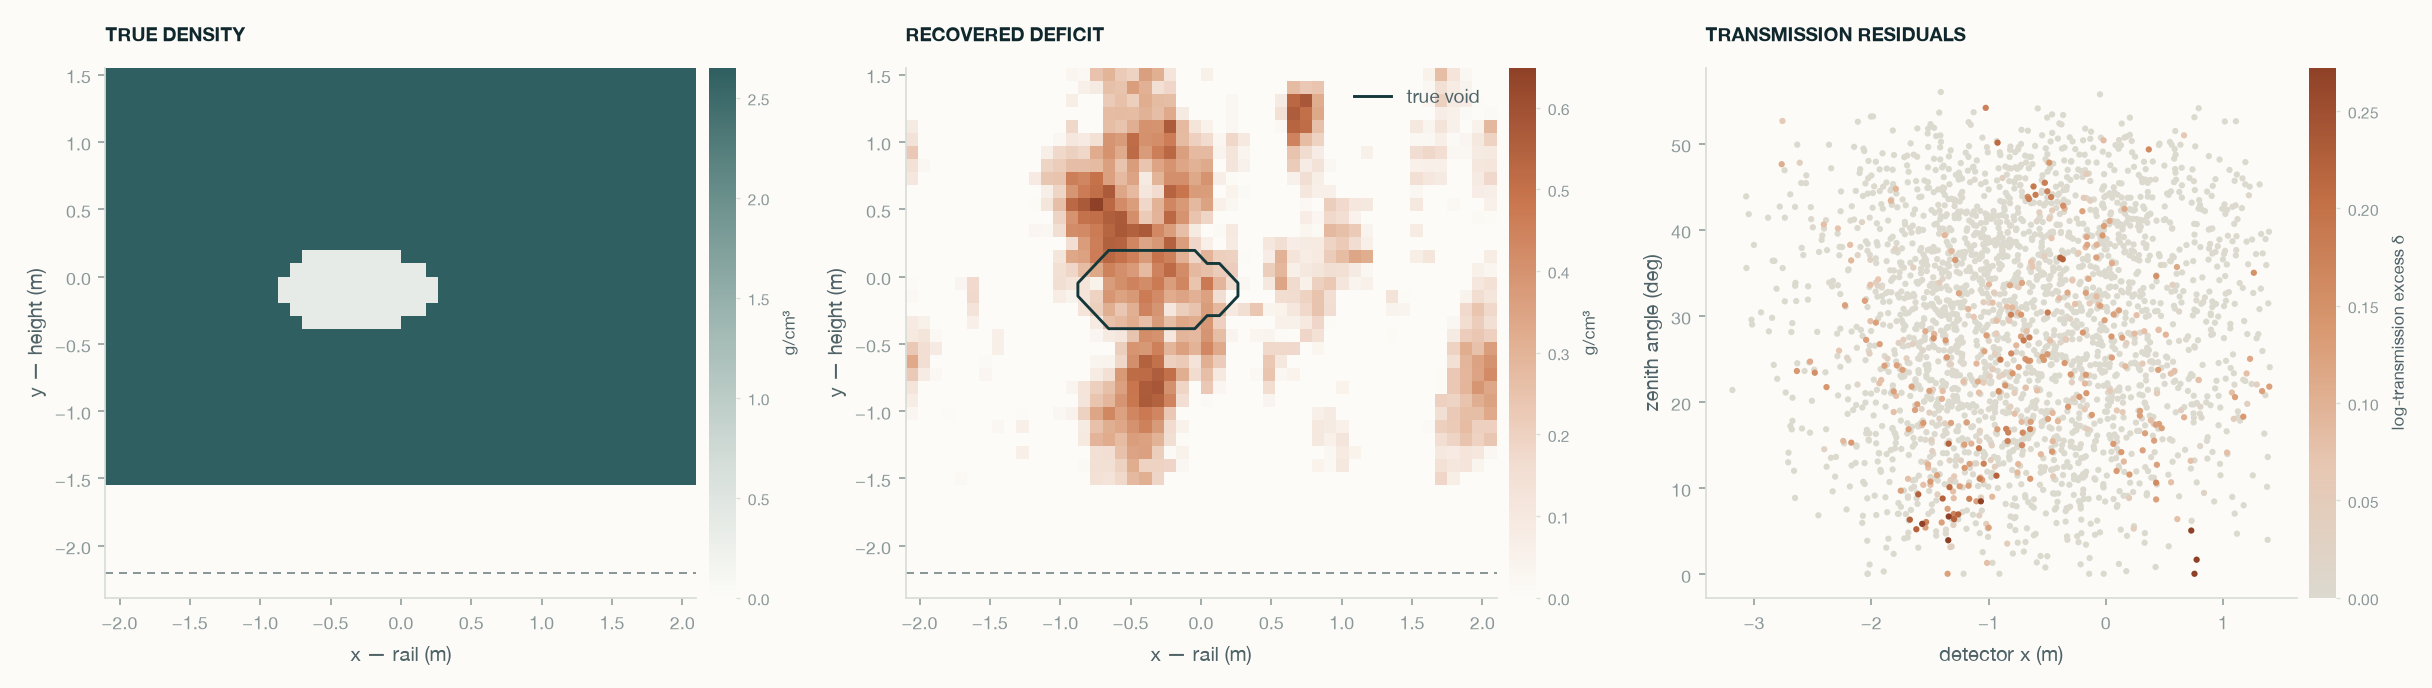
Goodness of fit against homogeneous rock, this run. Rock with no void scores about 0 σ.
Against 2.65 g/cm³ rock: the deficit is resolved, its full depth is not.
The recovered deficit sits on the true void in x and z.
Plan offset from each of 20 true voids, worst 1.4 m. Detection 4.2 to 16.1 σ; twelve scans with no void stayed below 1.2 σ.
What the same run got wrong
- Vertical smearing is realThe centre panel streaks up and down because the detector samples from one rail. Depth is the weakest axis, and the recovered deficit sits shallower than the truth.
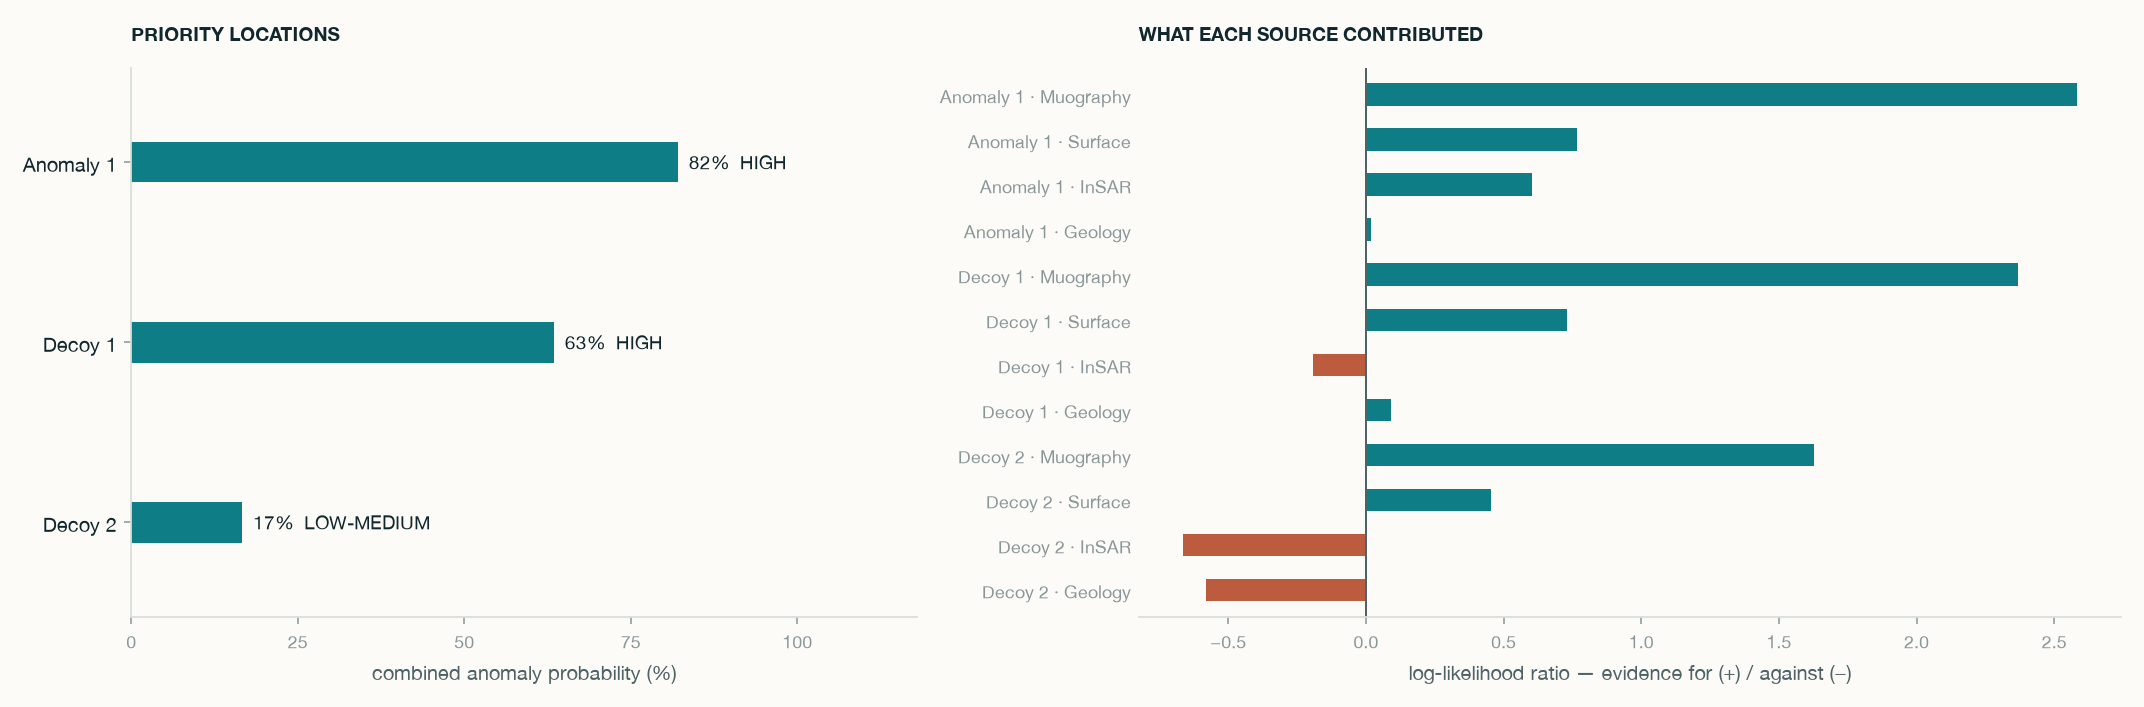
- An artefact scored HIGHMuography alone ranked a streak artefact at 96%. Adding the other sources pulled it to 63% while the real void held 82%: the order is right, but the artefact still lands in the HIGH band.
- Which is why the report existsA score is a reason to verify, not a conclusion. Every priority location comes with a recommended check, because this is the failure the geometry permits.
Read the full example reportThe report this run produced, unedited. Simulated site, labelled as such at the top.
05Try it
Try it yourself, or test it with us.
Both tools open in the browser, in English, with nothing to install.
Live simulation demo
The full chain on three simulated sites: a disused tunnel, a mine roadway and a classroom bench, each reconstructed from its own data rather than drawn from the answer.
Analysis console, read-only
Screen the built-in surveys, open your own event file and follow a run from scan to cited report. Uploads and report generation stay on the private platform.
Research collaboration
For groups with a hypothesis to test. Before any data is taken, we agree the endpoint, the reference data and how the result will be judged.
Tell us about the site. We will tell you whether it can be measured.
Four things are enough for a first answer:
- What you are looking for, and where
- Where a detector could sit, and how to reach it
- The decision the result should support
- Any records you already hold: drawings, boreholes, inspections
- Check a siteCan the target be measured, and from where?
- Send us muon dataFrom any detector, CosmicWatch included.
- School cosmic-ray labStudents build a detector and run three experiments.
Or write to us directly
We reply to technical enquiries within two working days.
Founded in Hong Kong by experimental particle physicists and computational scientists. About the company